Learn more
Alerts by PilotAI
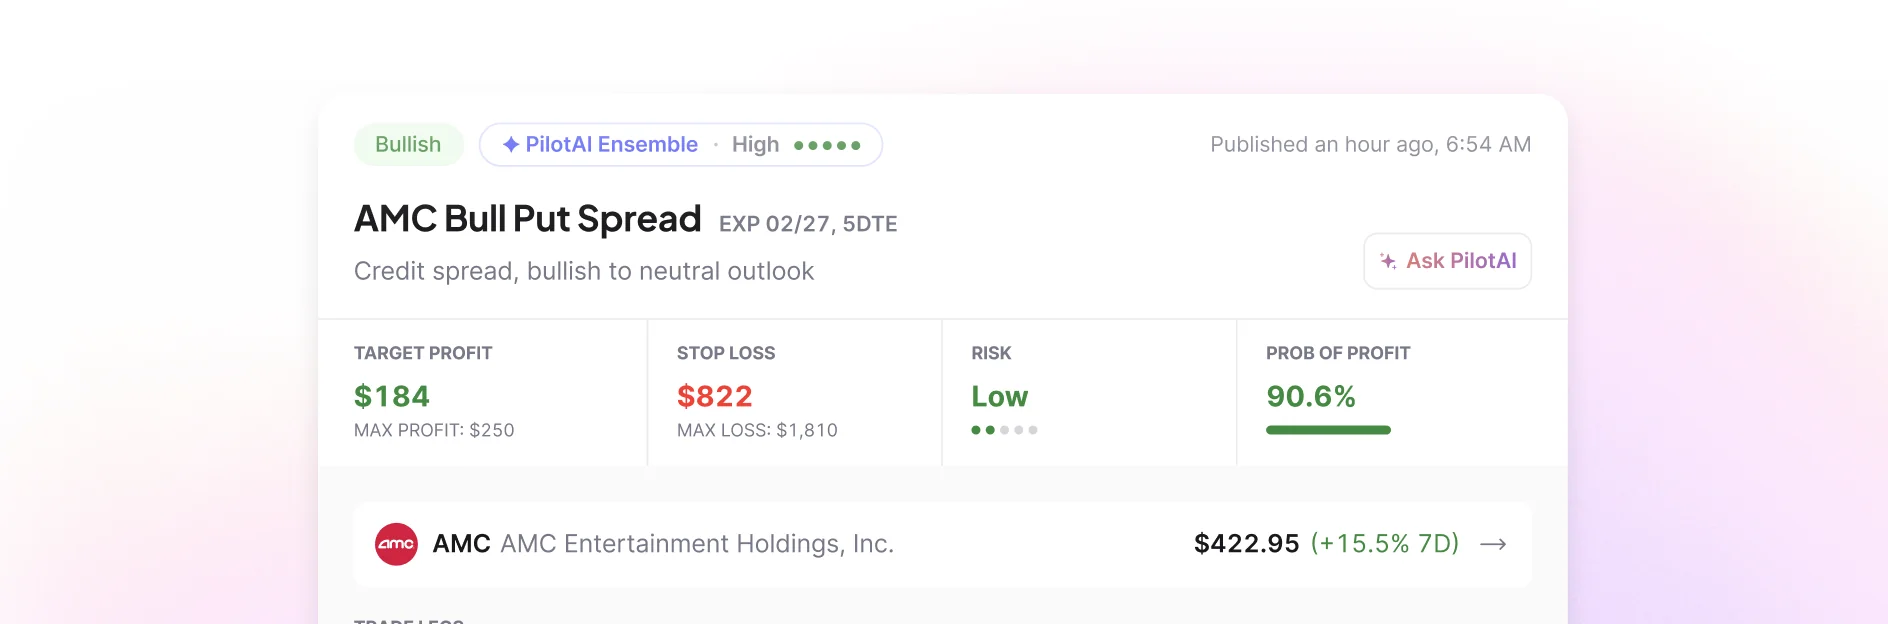
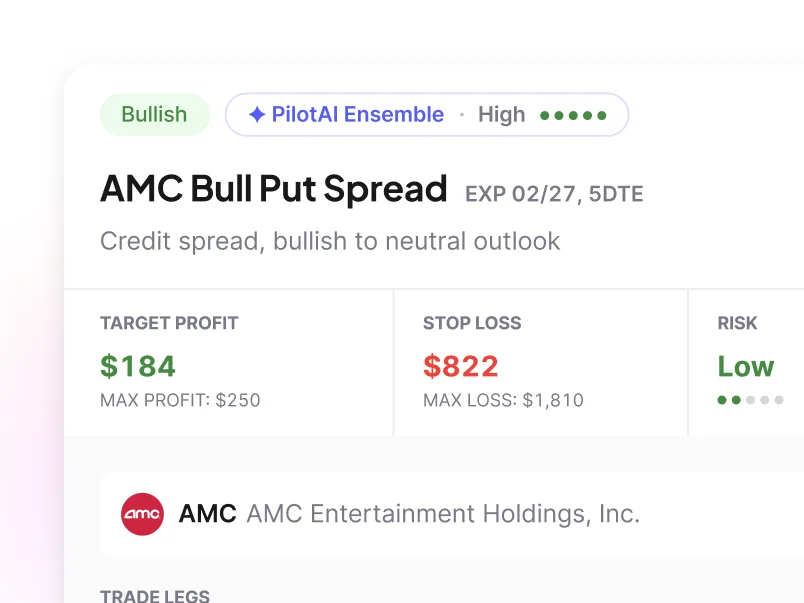
Trade opportunities with the work shown — AI- and analyst-curated signals across options, stocks, crypto, and futures.
Strategic investing, powered by AI
Trade opportunities with the work shown — AI- and analyst-curated signals across options, stocks, crypto, and futures.
50+ AI-built thematic portfolios, each constructed from live market data with the rationale fully visible before you invest.









AI-Related Companies
Biomedical and Genetics Industry
E-commerce Enablers
Dividend Aristocrats
Fallen Angels
Clean Energy Revolution
Gaming Giants
5G Infrastructure
Biotech Breakthroughs
Diversified Bluechips
Utilities Sector Stability Fund
Thematic Investing
Generated on October 21 at 12:00 AM
U.S. real GDP is expected to stay modestly above trend into 2027, but persistently high policy rates, elevated long‑term Treasury yields, and rising federal interest costs are likely to cap equity valuations even if earnings grow. Consensus now embeds a December Fed hike and a higher end‑2027 policy rate path near 4.5%, while 30‑year mortgage rates are projected around 7.4%–7.5%, pressuring housing, consumers, and rate‑sensitive assets. Corporate earnings expectations for late 2026 are unusually aggressive, requiring significant margin expansion at a time when wages, tariffs, and financing costs are rising. Tariff and fiscal risks threaten to add stagflationary pressure, potentially forcing yields higher and limiting the usual safe‑haven performance of long‑duration Treasuries. The most probable regime over the next 12 months is a volatile, range‑bound equity market where positive earnings collide with high discount rates, and where sector dispersion, balance‑sheet quality, and duration risk management dominate overall index direction.
This report is intended for informational purposes only, not financial advice. For tailored guidance, please consult a qualified financial advisor.
SHORT-TERM SENTIMENT
Slightly Bearish
MEDIUM-TERM SENTIMENT
Neutral
LONG-TERM SENTIMENT
Slightly Bullish
SECTOR OUTLOOK
Macro conditions favor cash‑generative, low‑leverage, shorter‑duration business models and higher‑quality credit, while housing‑linked, highly levered, and long‑duration growth exposures face structural headwinds from elevated yields, mortgage rates, and demanding earnings expectations. Sector returns are likely to diverge sharply depending on sensitivity to rates, fiscal risk, and tariff exposure rather than move uniformly with the broad index.
Information Technology / AI & Data Infrastructure
Slightly BullishIndustrials & Capital Goods
Slightly BullishUtilities & Power Infrastructure
Slightly BullishConsumer Discretionary
Slightly BearishReal Estate & Housing-Linked Industries
BearishConsensus forecasts point to continued, above‑trend U.S. real GDP growth of about 2.3% in 2026 and 2.1% in 2027, suggesting the economy likely avoids an immediate recession. However, markets now expect the Federal Reserve to skip an October move but hike again in December and to keep policy rates near 4.5% into 2027, implying a structurally higher discount‑rate regime. This supports nominal revenue and earnings but is not automatically bullish for equity indices, because rising rates, elevated long‑term yields, and fiscal risk can compress valuation multiples even as earnings grow.
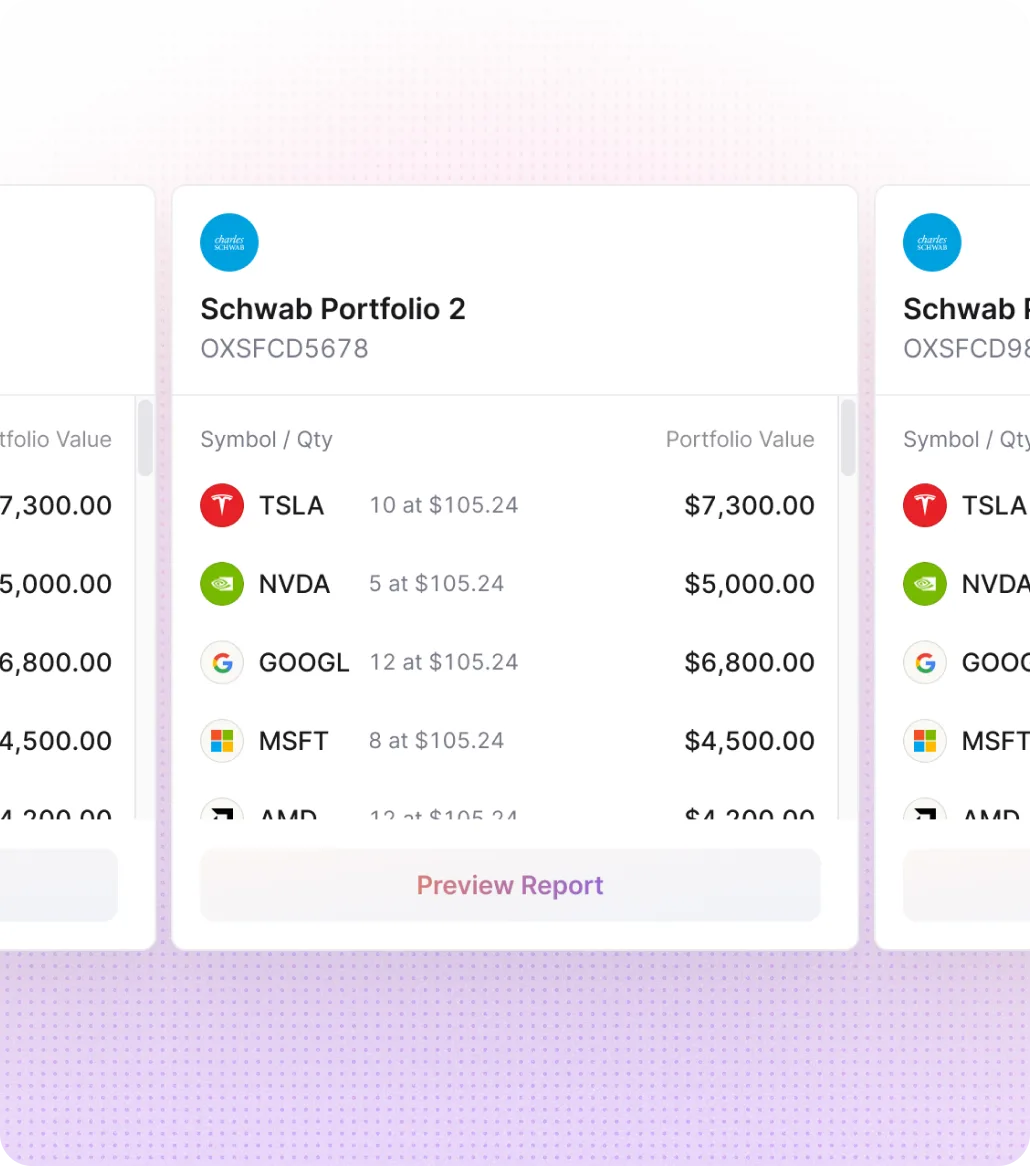
Get a real-time breakdown of your portfolio's performance, sector exposure, and risk concentration — all in one dashboard.
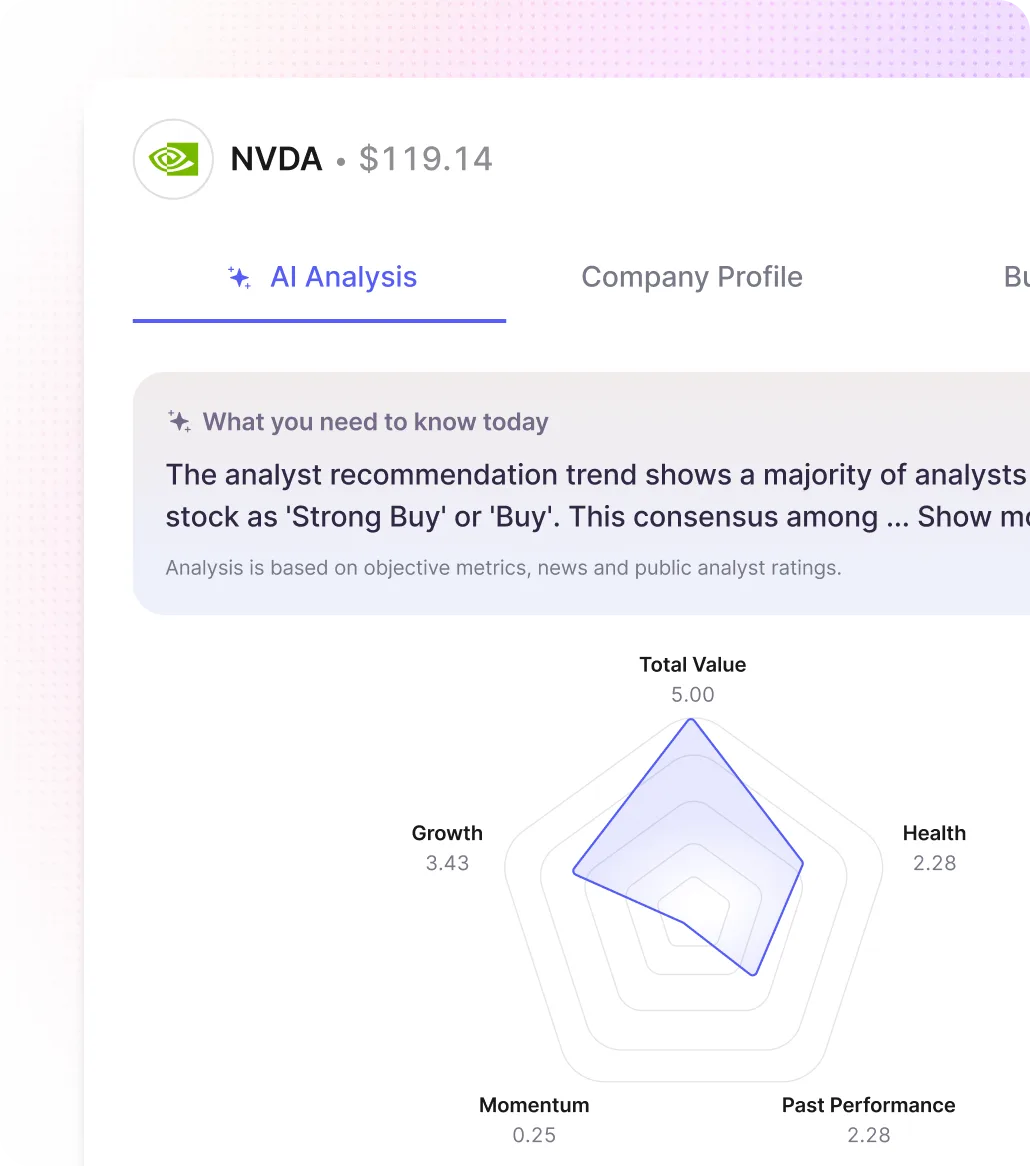
PilotAI portfolios come with comprehensive metrics; you can also connect your own portfolios for analysis.

Automatically receive rebalancing recommendations when your allocation drifts — aligned to your strategy's target weights.

Ask anything about your portfolio, market conditions, or specific tickers. PilotAI responds with data-backed, plain-English insights.
PilotAI showed me exactly why each position was in the strategy - the conviction scores and the signals behind them. For the first time I understand what I'm holding instead of guessing.
PilotAI Member
Subscriber for 5 months
Rebalancing used to be the part I avoided. Now PilotAI hands me the exact position changes when drift crosses the threshold and I apply them in one click. My paper portfolio finally stays on target.
Verified Member
Subscriber for 5 months
These results are not typical. Individual results vary significantly and depend on portfolio size, market conditions, and timing of entry. This is not a guarantee of future performance. *Past performance is not indicative of future results.
An AI-driven investing platform. Through Strategies, PilotAI builds 50+ thematic portfolios from live market data — each with its holdings, rationale, and per-ticker conviction scores fully visible. Currently paper-trading, no funding required.
AI analyzes live market data — flow, sentiment, fundamentals — to build each portfolio. Every position carries a conviction score and the signals that placed it there.
Pick one, see its allocation and rationale, and follow it as a paper portfolio. PilotAI tracks the positions and prompts rebalancing as conviction or drift shifts.
PilotAI tracks your paper portfolio against the strategy's target weights. When drift crosses the threshold, you get a rebalancing recommendation with exact position changes pre-calculated — one click to apply. No manual math.
Yes. Connect a brokerage account and PilotAI returns sector exposure, risk concentration, performance breakdowns, and AI analysis per holding. We only read connected accounts — never trade or manage them.
PilotAI is free. Click 'Build a portfolio' to sign up. Contact sales for a premium experience.